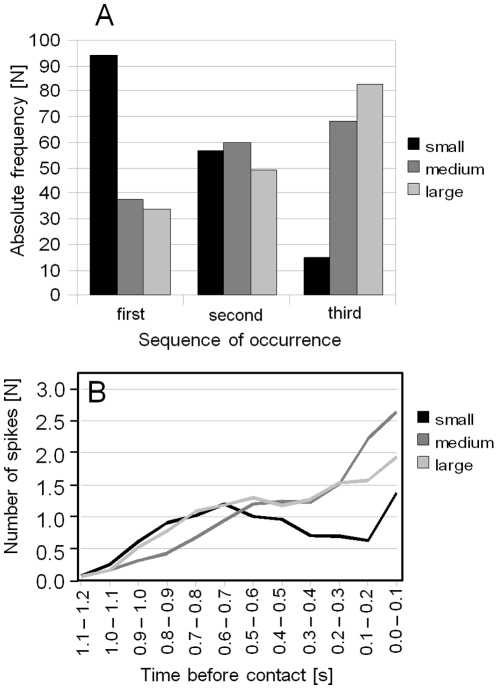
Figure 7. Analysis of the response of three different wind-sensitive interneurons to bats approaches.
Three different wind-sensitive interneurons were classified according to their extracellular spike amplitudes into small, medium, large units. (A) The first response of different interneuron classes shown as frequency histogram. Data summarized in A was obtained from 166 platform landings (15 T. cantans individuals). (B) The average number of spikes of different wind-sensitive interneurons counted in time windows of 100 ms (125 platform landings obtained from 15 T. cantans individuals). A significant negative correlation of the average spike count with bat-to-preparation distance was found for large and medium units (p<0.001, cc = −0.993 (medium), cc = −0.965 (large), N = 12, Spearman Rank Order correlation).

