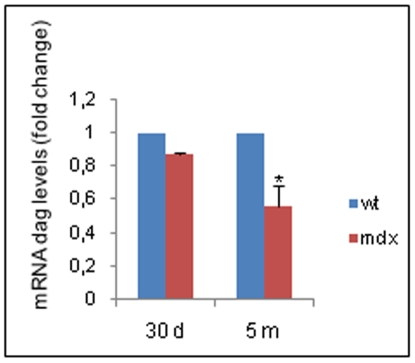
Figure 1. Dystroglycan mRNA expression.
The mRNA levels from the gastrocnemius muscle tissues of wt and mdx mice of different ages (30 d, 30-day-old mice; 5 m: five-month-old mice) were assessed by qRT-PCR; relative gene expression was calculated by the comparative Ct method (2−ddCt). The Ct values of each gene were normalized to the Ct value of GAPDH in the same RNA sample. The mRNA levels in the mdx samples are expressed as fold change compared to those in wt samples. All values represent the mean ± SD from experiments performed on three different RNA preparations of the muscle tissues from wt and mdx mice (see Methods). *P<0,05 versus wt (P = 0,0465 measured by the Mann-Whitney test).

