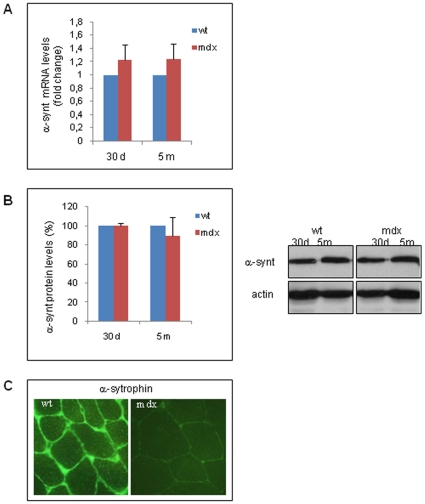
Figure 2. α-syntrophin mRNA and protein expression.
A: The mRNA levels in the gastrocnemius muscle tissues from wt and mdx mice of different ages (30 d, 30-day-old mice; 5 m: five-month-old mice) were determined by qRT-PCR and calculated by the comparative Ct method (2−ddCt). The Ct values of each gene are normalized to the Ct value of GAPDH in the same RNA sample. The mRNA levels in the mdx samples are expressed as fold changes compared to those in wt samples. All values represent the mean ± SD from three different experiments performed on different RNA preparations of the muscle tissues from wt and mdx mice (see Methods). B: Total protein extracts from the gastrocnemius muscle tissues of wt and mdx mice of the indicated ages were resolved by SDS-PAGE and probed with an α-syntrophin antibody. A representative western blot is shown. The graph values represent the mean ± SD of the densitometric analyses from three different experiments with different animal samples (see Methods). Data are presented as the percentage of protein in mdx mice compared to that in wt mice, normalized to endogenous actin expression level. C: Frozen sections of the gastrocnemius muscles obtained from wt and mdx adult mice were probed with an anti-α-syntrophin antibody and visualized using a secondary antibody coupled to a fluorescent marker, FITC. A representative of the two performed analyses on two different five-months-old wt and mdx mice, is shown.

