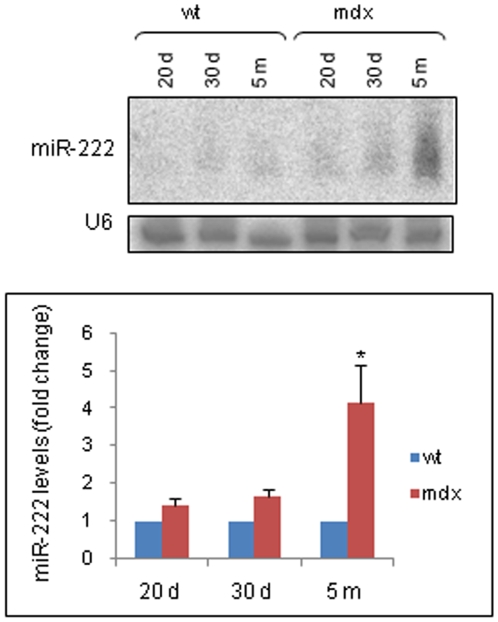
Figure 5. miR-222 expression levels in wt and dystrophic skeletal muscle tissues.
A: MiR expression was evaluated by northern blot analysis in the gastrocnemius muscle tissues from wt and mdx mice of different ages; U6 levels were used as loading controls. A representative blot from four experiments is shown. B: Northern blot signals were quantified by densitometric analysis. The graph shows the mean ± SD from four independent experiments. For each experiment, pooled muscle tissues were used (see Methods). The miR-222 levels in dystrophic samples are expressed as fold change relative to those in control samples. Statistical significance was determined as *P<0,05 versus wt (P = 0,024 measured by the Mann-Whitney test).

