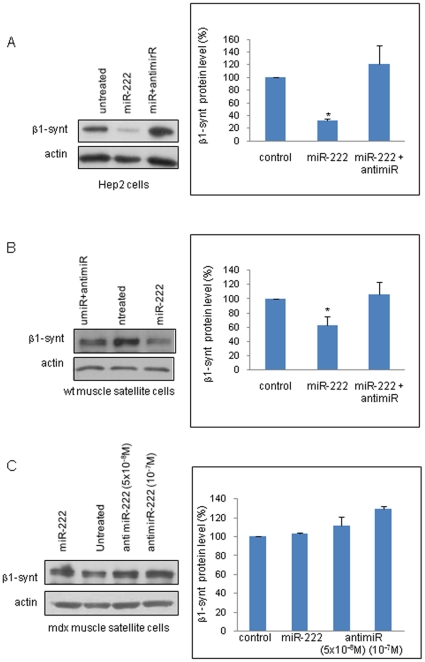
Figure 7. miR-222 modulation of β1-syntrophin levels.
Hep2 cells (A) and, muscle satellite cells from wt mice (B) or from mdx mice (C) were transfected with miR-222 and/or antimiR-222. Total protein extracts were prepared and analyzed by western blot to assess β1-syntrophin levels. At least three experiments were performed and representative experiments are shown. The graph values represent the mean ± SD of the densitometric analyses from independent experiments (n = 3 for Hep2 cells and mdx satellite cells; n = 4 for wt satellite cells). The data are presented as the percentage of protein in treated cells compared to that in untreated cells, normalized to endogenous actin expression level. Statistical significance was determined as *P<0,05 versus untreated cells, measured by the Mann-Withney test (Hep cells, P = 0,019; wt satellite cells, P = 0,036).

