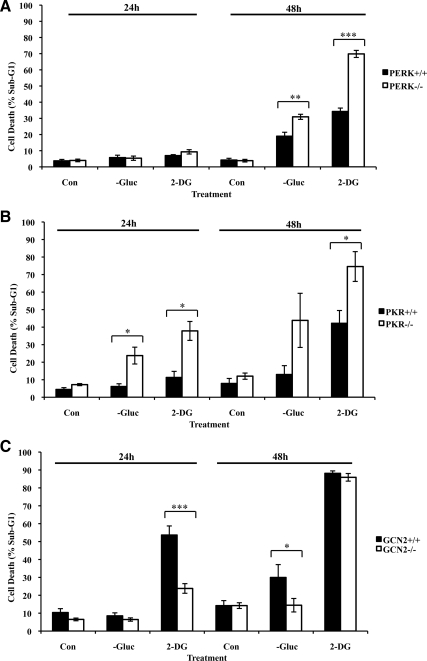
Figure 3.
Distinct roles of eIF2α kinases in response to glucose deprivation. PERK+/+ and PERK−/− MEFs (A), PKR+/+ and PKR−/− MEFs (B) or GCN2+/+ and GCN2−/− MEFs (C) were kept in media containing glucose (Con), media lacking glucose (−Gluc), or media containing glucose supplemented with 50 mM of 2-deoxyglucose (2-DG) for 24 or 48 h. The percentage of cells in sub-G1 phase, which represents cell death, was measured by propidium iodide staining and flow cytometry analysis (see also Supplementary Figures 2–4). Histograms show the average cell death ± SEM calculated from six, five, and seven reproducible experiments for PERK, PKR and GCN2 MEFs, respectively. Two-tailed t test: *p < 0.05, **p < 0.01, ***p < 0.001).

