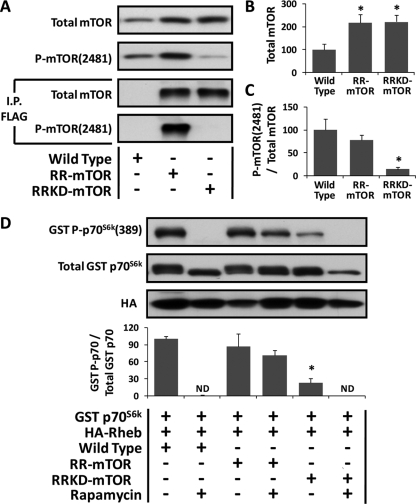
Figure 6.
Confirmation of the phenotypes in RR-mTOR and RRKD-mTOR transgenic mice. (A) TA muscles from wild-type, RR-mTOR, and RRKD-mTOR mice were collected, and whole muscle lysates were subjected directly to Western blot analysis or subjected to immunoprecipiation (I.P.) for the FLAG-tag followed by Western blot analysis with the indicated antibodies. (B and C) Quantification of total mTOR (B) and the ratio of P-mTOR(2481) to total mTOR (C) in whole muscle lysates. The data are expressed as a percentage of the values obtained in wild-type muscles. *, significantly different from wild type, p ≤ 0.05. (D) TA muscles from wild-type, RR-mTOR and RRKD-mTOR mice were cotransfected with HA-Rheb and GST p70S6k. Immediately after transfection, mice were subjected to a regime of daily vehicle or 1 mg/kg rapamycin injections. At 48 h after transfection, the muscles were collected, and lysates were subjected to Western blot analysis with the indicated antibodies. The ratio of GST P-p70S6K(389) to total GST p70S6K (GST P-p70/Total GST p70) was calculated and expressed as a percentage of the values obtained in wild-type vehicle-treated samples. Values are the mean + SEM, n = 3–5/group. *, significantly different from wild-type vehicle-treated samples, p ≤ 0.05. ND, not detected.

