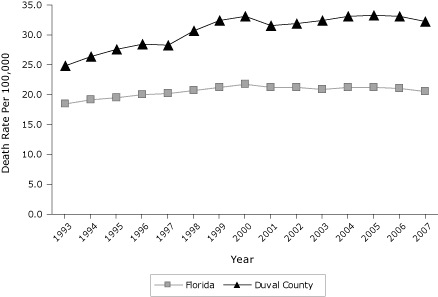
Figure 1.
Yearly trend in age-adjusted diabetes 3-year death rate per 100,000. Three-year rate is calculated by summing the 3 years of deaths and dividing by 3 to obtain the annual average of events, followed by calculating the age-specific rates for each year. Data source: Florida Department of Health, Bureau of Vital Statistics, 1998-2008.
| Year | Death Rate Per 100,000 Population | |
|---|---|---|
| Florida | Duval County | |
| 1993 | 18.5 | 24.8 |
| 1994 | 19.1 | 26.4 |
| 1995 | 19.6 | 27.5 |
| 1996 | 20.0 | 28.4 |
| 1997 | 20.1 | 28.3 |
| 1998 | 20.7 | 30.8 |
| 1999 | 21.3 | 32.4 |
| 2000 | 21.7 | 33.0 |
| 2001 | 21.3 | 31.5 |
| 2002 | 21.1 | 32.0 |
| 2003 | 20.8 | 32.5 |
| 2004 | 21.2 | 33.1 |
| 2005 | 21.2 | 33.3 |
| 2006 | 21.1 | 33.2 |
| 2007 | 20.6 | 32.1 |

