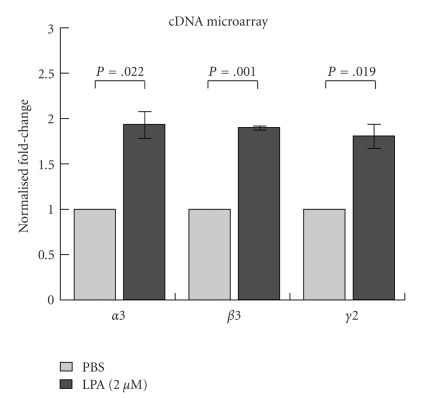
Figure 2.
cDNA microarray analysis. Microarray analysis was performed on PBS and LPA-treated samples using Affymetrix Human U133 plus 2.0 chips according to manufacturer's instructions, and data were normalized using the Microarray Suite 5.0 algorithm. Among the upregulated genes induced by LPA, all three subchains of the intact Ln-332 molecule: α3 chain (LAMA3), laminin β3 (LAMB3), and laminin γ2 chain (LAMC2) were significantly increased.

