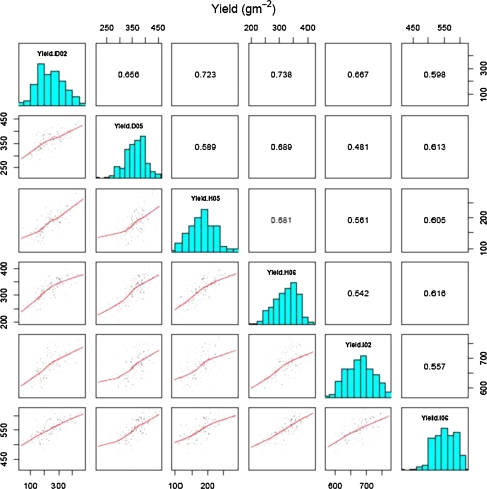
Fig. 1.
Trait association for yield across all six trials of the Seri/Babax population grown between 2002 and 2006. The diagonal contains the yield histogram for each trial, the lower diagonal a scatter plot and loess smoothing line between all trials, and the upper diagonal contains the phenotypic correlations

