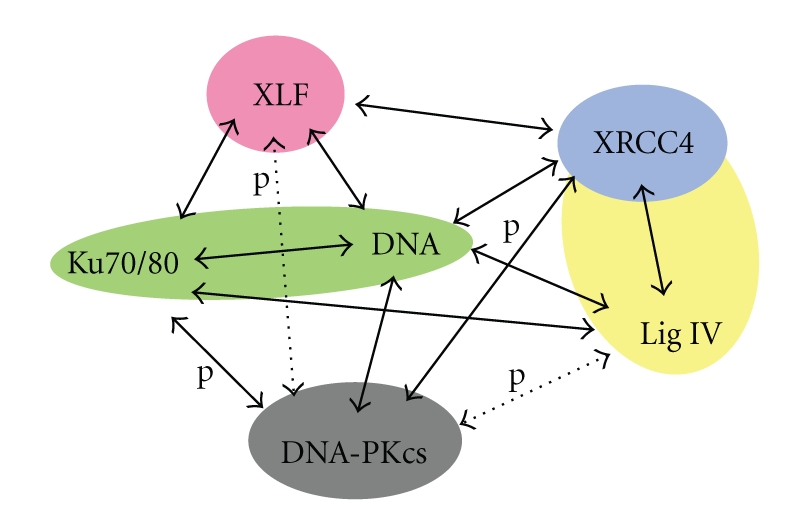
Figure 1.

Schematic diagram of interactions of the NHEJ machinery. Colour-filled shapes indicate the proteins and complexes with known 3D structures. Solid arrows indicate confirmed whereas dashed arrows are plausible interactions. Phosphorylation events are indicated by letter “p”.
