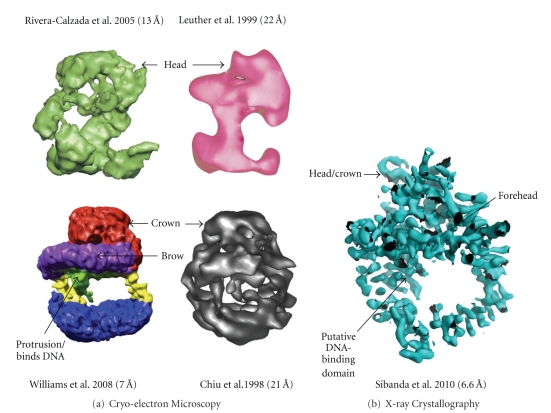
Figure 4.
Equivalent views of DNA-PKcs as defined by (a) Cryo-electron microscopy and (b) X-ray protein crystallography. References to the publications and resolutions of the models are given above. Colour coding of these EM structures are as given in their respective publications [44–47]. The X-ray crystallographic experimental electron density map is as defined by Sibanda et al. [48].

