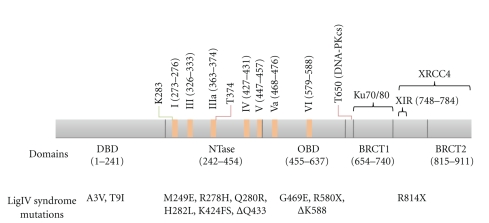
Figure 9.
Schematic diagram of human DNA ligase IV. Domain boundaries shown in the figure are based on the crystallographic structure of human DNA ligase I [73] and BRCT domains of LigIV [94]. Conserved motifs (I, III, IIIa, IV, V, Va, and VI) are shown in orange rectangles [69, 70]. The conserved catalytic lysine is indicated in green line. Reported phosphorylation sites are indicated by red lines [81, 99]. LigIV syndrome mutations are shown under domains [72, 100]. Ku and XRCC4 interaction regions are indicated with black brackets [29, 84, 94].

