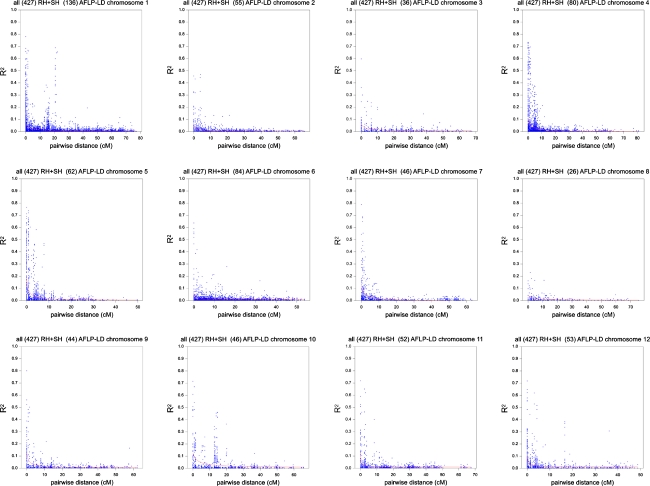
Fig. 4.
Genome-wide LD in potato. LD decay across the 12 potato chromosomes based on 720 AFLP markers collected over 427 potato genotypes using log-transformed normalised band intensities. As LD measure r 2 has been used. Map positions in cM were deduced from the ultra dense potato genetic map (van Os et al. 2006). Each plot represents the LD pattern of one chromosome. The title of each plot mentions the number of markers between brackets that was used for the pattern reconstruction of a particular chromosome, e.g., 136 for chromosome 1

