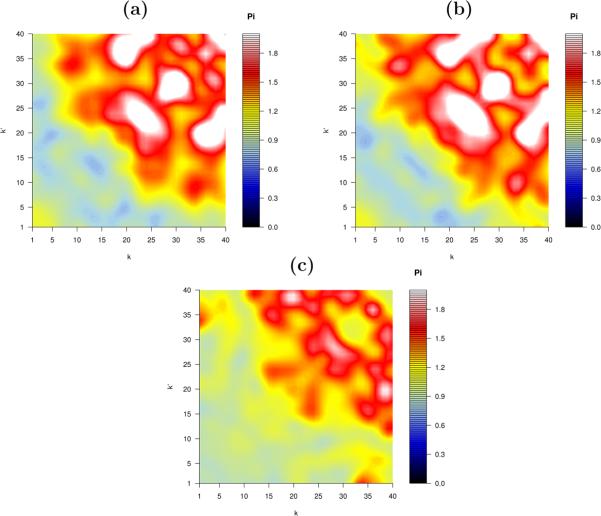
Figure 2.
Results of Markov chain graph dynamics proposed in [17] tailored to generating equilibrium random graph ensembles with specific degree sequences and specific degree correlations. (a): Colour plot of the relative degree correlations Π(k, k′|c) as measured in the Escherichia coli PPIN (here N = 2457 and  k
k = 7.05). (b): colour plot of Π(k, k′|c) in the synthetic graph c′ generated with Markov chain dynamics targeting the measured degree correlation if the PPIN, after 67, 147 accepted moves. (c): colour plot of Π(k, k′|c′) in the final graph generated with dynamics targeting Π(k, k′) = 1 ∀ (k, k′), after 1,968,000 accepted moves.

