Figure 5.
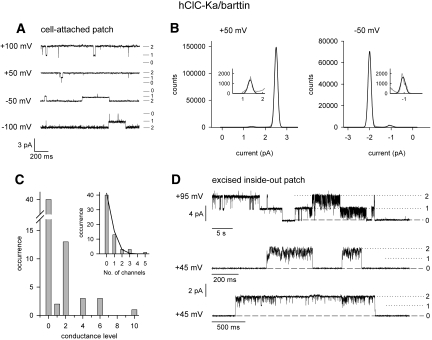
Single channel recordings show fast protopore gating in hCIC-Ka/barttin channels. (A) Single-channel recordings from a cell-attached patch at holding potentials between −100 and +100 mV. (B) Amplitude histograms of the registrations shown in (A) and fits with the sum of three equidistant Gaussian distributions. (C) Frequency distribution of patches containing a certain number of current levels. (D) Single-channel recordings from excised inside-out patches at holding potentials of +95 or +45 mV.

