Figure 3.
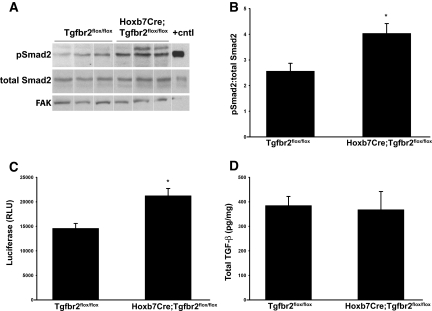
Hoxb7Cre;Tgfbr2flox/flox mice have increased active TGF-β compared with Tgfbr2flox/flox mice. (A) pSmad2 immunoblots are performed on obstructed kidney lysates from Hoxb7Cre;Tgfbr2flox/flox and Tgfbr2flox/flox mice 3 days after UUO. TGF-β–treated cells are used as a positive control. Three representative blots per genotype are shown, and the vertical white line separates samples that are rearranged from two blots performed simultaneously and developed for equivalent times. (B) Band intensity is quantified as a ratio of pSmad2 to total Smad2 using densitometry. Data are derived from five mice per genotype and reported as the mean ± SEM. *P < 0.05. (C) Active TGF-β is determined by the PAI/L assay, as described in the Concise Methods section. Composite values for six mice per genotype at 3 days after UUO are reported as the mean in random luciferase units (RLU) ± SE. *P < 0.05. (D) Total TGF-β levels from kidney lysates 3 days after UUO are measured by an ELISA assay. The data represent the average values of TGF-β (pg) per mg of protein for five mice in each genotype.

