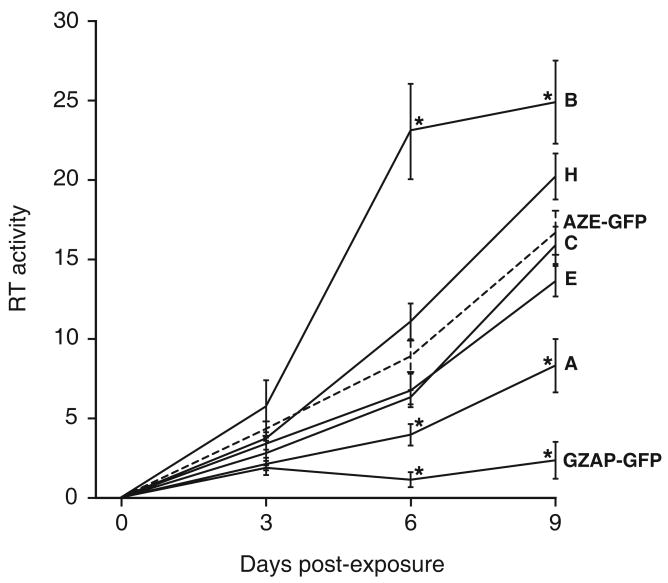
Figure 5.
Replication of viruses as measured by reverse transcriptase activity. LNCaP cells were exposed to each virus at an MOI of 0.1 with GZAP-GFP, the indicated GZAP-GFP variants, or AZE-GFP, and RT activity in the cultures was monitored over the following nine days. RT activities are expressed in arbitrary units and are the average obtained from triplicate infections. Error bars represent standard deviations. Asterisks denote RT activities that were significantly different (p < 0.05 by two-tailed, paired t-test) from those of AZE-GFP at the same time point. The values for AZE-GFP are shown by a dashed line for reference. The RT value for Day 0 represents the activity in cultures immediately before infection.

