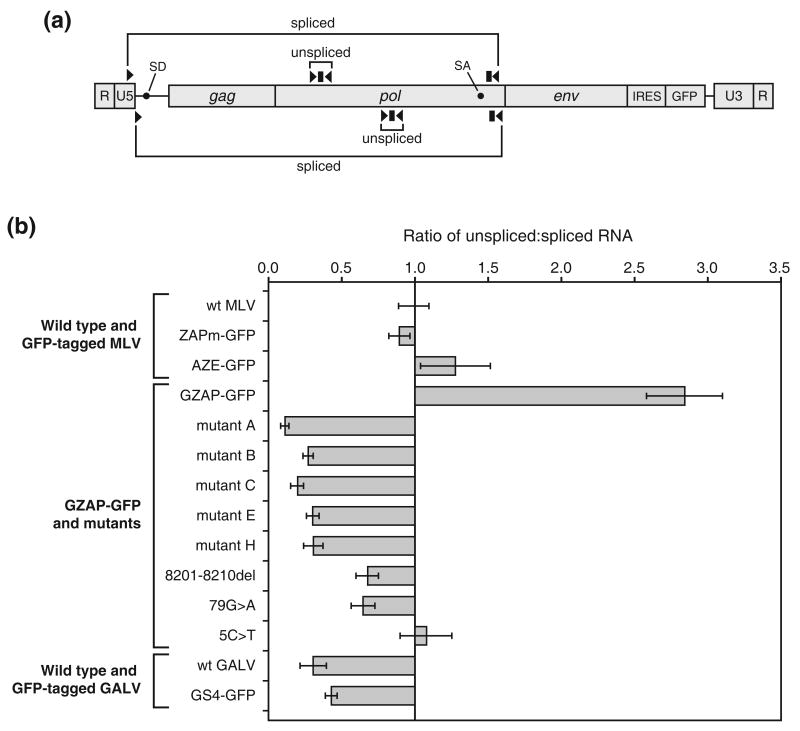
Figure 8.
Quantitation of the levels of spliced and unspliced viral RNA produced by MLV, GALV and chimeric viruses. RNA isolated from cells transfected with the provirus-containing plasmids was reverse transcribed and used in TaqMan PCR. (a) Schematic diagram of the gammaretroviral RNA genome showing locations of the primers (arrowheads) and probes (rectangles) used to measure the levels of unspliced and spliced transcript. The primer-probe sets above the RNA diagram represent the location of those used for wild type and GFP-tagged MLV and for GZAP-GFP and its mutants. The primer probe sets below the RNA diagram represent the location of those used for wild type and GFP-tagged GALV. Black circles indicate the locations of the splice donor and acceptor sites in the viral RNA. (b) Results of quantitation of the transcripts, expressed as the ratio of unspliced to spliced viral RNA. The ratio for wild type MLV (Moloney strain) was arbitrarily set to 1, and the ratios for all other viruses are normalized to this value. Each value is the mean ratio obtained from at least three amplifications, and error bars represent standard deviations. ZAPm-GFP is identical to AZE-GFP and GZAP-GFP but contains the ecotropic MLV env gene.

