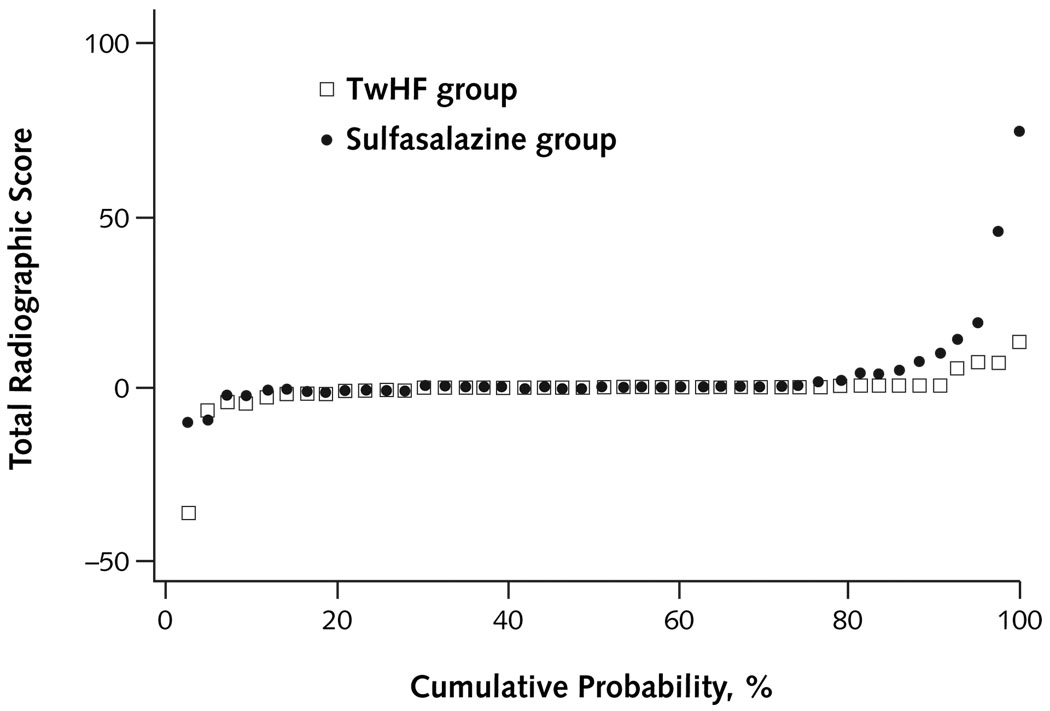
Appendix Figure 2. Probability plot of change in radiographic score from baseline to end of study.
The probability plot shows changes in total radiographic score from baseline to follow-up ranked for magnitude of change and organized by treatment group of all participants with available data. The graph shows that more patients in the sulfasalazine group than in the TwHF group have an increase in radiographic scores and that the magnitude of the increase is also larger in the sulfasalazine group than in the TwHF group. The graph also shows that most patients in both treatment groups have no radiographic progression. All of these patients are graphed at or around zero. TwHF = Tripterygium wilfordii Hook F.

