
Figure 1.
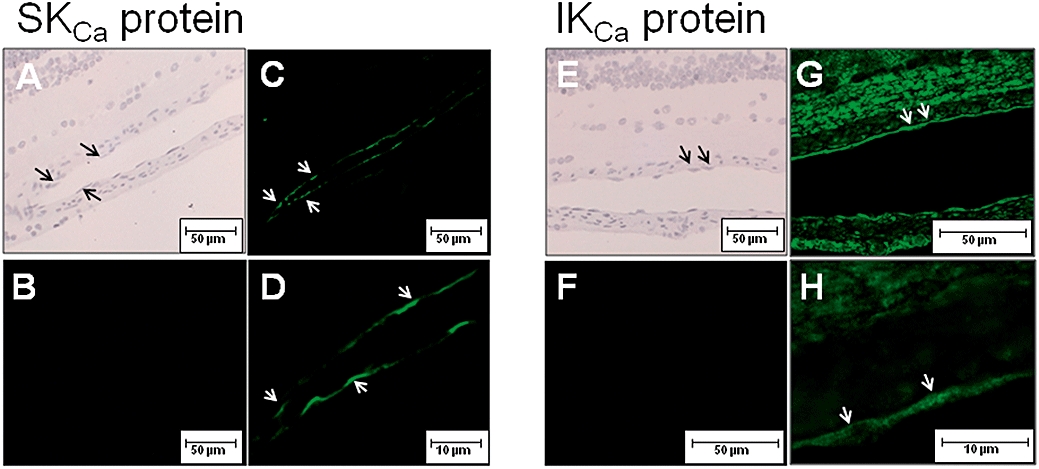
H&E staining (A, E) and localization of SKCa3 protein (C, D) and IKCa protein (G, H) by immunoreaction (green fluorescence, arrows) in retinal arterioles. B and F are negative controls without primary antibody. D and H are enlargements of C and G. The scale bars in A-C, E-F are 50 µm, and in D and H 10 µm.