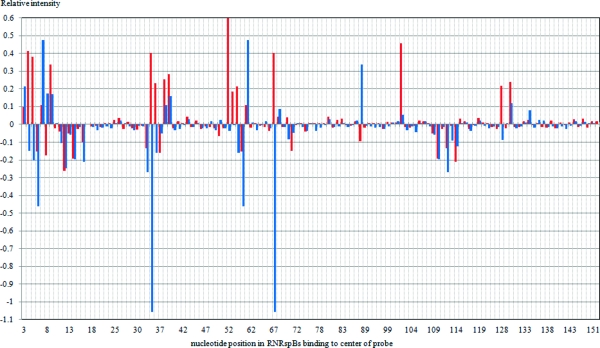
Figure 6.
Relative intensities of RNRspBs binding to probes under different salt conditions. Blue bars indicate relative intensities of probes in 140Na/80HEPES/10Mg and 135K/25Na/50HEPES/10Mg. Red bars indicate relative intensities of probes in 135K/25Na/50HEPES/1MNa and 135K/25Na/50HEPES/10Mg. Relative intensities are calculated with the equation, relative intensity = normalized intensitybuffer X − normalized intensity135K/25Na/50HEPES/10Mg. Buffer X denotes 140Na/80HEPES/10Mg or 135K/25Na/50HEPES/1MNa. Positive values indicate that probes bind more tightly in 140Na/80HEPES/10Mg or in 135K/25Na/50HEPES/1MNa buffer than in 135K/25Na/50HEPES/10Mg buffer. Negative values indicate that probes bind more tightly in 135K/25Na/50HEPES/10Mg buffer than in either 140Na/80HEPES/10Mg or 135K/25Na/50HEPES/1MNa buffer.

