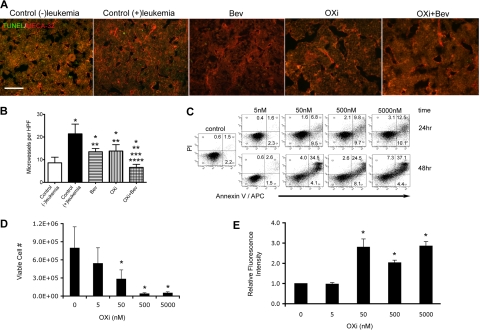
Figure 3.
Effects of OXi4503 treatment on bone marrow blood vessels and leukemia cells. (A) MECA-32 staining demonstrated abundant blood vessels throughout bone marrow sections regardless of treatment type (scale bar: 50 μm). (B) Quantification of microvessel density was performed for all treatment and control groups. An additional control group without leukemia transplantation was added to assess the effects of leukemia on microvessel density. * represents significance in comparison to control (−)leukemia group; **, significance in comparison to control (+)leukemia group; ***, significance in comparison to bevacizumab alone group; and ****, significance in comparison to OXi4503 alone group. (C) Leukemic KG-1 cells were incubated with OXi4500 at differing concentrations for 24 hours and the numbers of viable cells quantified using trypan blue dye exclusion. Under these conditions, concentrations of 50nM or higher showed significant decreases in cell viability versus controls. (D) OXi4500 treatment induces apoptosis of leukemic KG-1 cells. After a 24-hour treatment with OXi4500, cells were stained with annexin V and PI and the percentage of apoptotic cells determined using flow cytometry. (E) The generation of ROS was assessed in KG-1 cells at different OXi4500 concentrations by H2DCFDA staining. After 48 hours, ROS were detected at concentrations of 50nM or higher. Relative fluorescent intensity values were normalized to controls (0nM OXi4500). Values represent mean ± SEM; *P < .05; **P < .05; ***P < .05; and ****P < .05. Gating was established using appropriate isotype controls.

