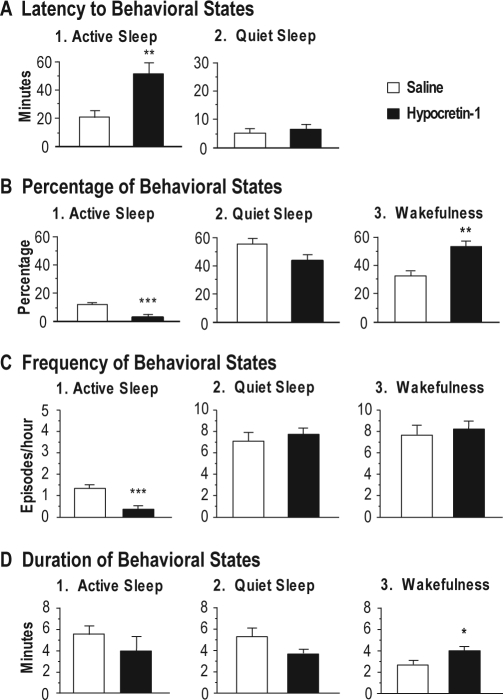
Figure 3.
Effects of hypocretin-1 injections into the nucleus pontis oralis on the latency (A), percentage (B), frequency (C) and duration (D) of wakefulness, quiet sleep, and active sleep during the first hour following injections that were carried out while the animals were awake. Bars represent mean values; error bars indicate the SEM of each population. A: Graphs show the latency to the onset of the first episode of active sleep and quiet sleep following injections of hypocretin-1 (n = 13) and saline (n = 10). Injections of hypocretin-1 significantly increased the mean latency to active sleep. Because injections were carried out during wakefulness, there was no measure of the latency to wakefulness. B: Histograms illustrate the percentages of behavioral states observed following the injection of hypocretin-1, which significantly increased the percentage of time spent in wakefulness and decreased active sleep, compared with saline injections. C: Graphs present the number of episodes of behavioral states per hour (frequency) following the injection of hypocretin-1 and saline. Note that injections of hypocretin-1 significantly reduced the frequency of episodes of active sleep. D: Graphs showing that hypocretin-1 significantly increased the mean duration of episodes of wakefulness. Asterisks indicate the levels of statistical significance of the difference between means: *P < 0.05, **P < 0.01, ***P < 0.001 by unpaired t-test.

