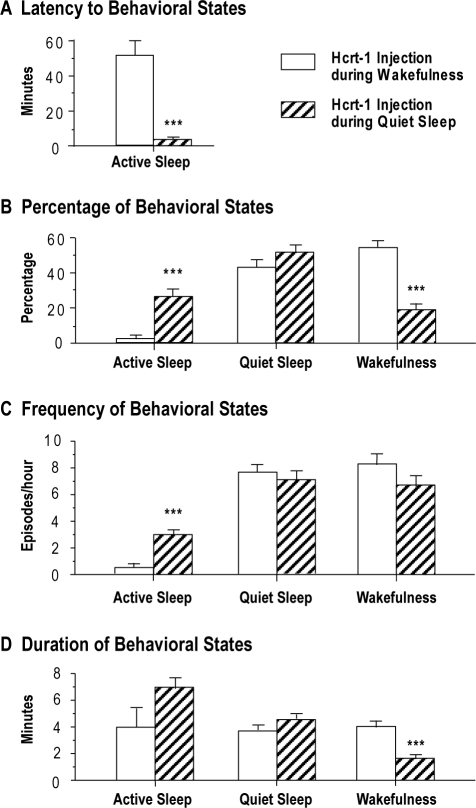
Figure 4.
Comparisons of the effects of hypocretin-1 (Hcrt-1) injections into the nucleus pontis oralis on the latency (A), percentage (B), frequency (C), and duration (D) of wakefulness, quiet sleep, and active sleep following the injection of Hcrt-1 during quiet sleep or wakefulness. Bars represent the mean values; error bars indicate the SEM of each population. A: Graphs show the latency to the onset of the first episode of active sleep following injections of Hcrt-1 during either quiet sleep (n = 14) or wakefulness (n = 13). Injections of Hcrt-1 during wakefulness significantly increased the mean latency to active sleep. B: Histograms illustrating the percentages of behavioral states following the injection of Hcrt-1 during quiet sleep, which significantly increased the percentage of time spent in active sleep, compared with the percentages following the injection of Hcrt-1 during wakefulness. In contrast, the animals spent a significantly greater the percentage of time in wakefulness following injections of Hcrt-1 during this state, compared with the time spent in wakefulness following injections during quiet sleep. C: Graphs present the frequency of episodes of behavioral states following the injection of Hcrt-1 either during quiet sleep or wakefulness. Injections of Hcrt-1 during quiet sleep significantly increased the frequency of episodes of active sleep. D: Graphs show that injections of Hcrt-1 during wakefulness resulted in a significant increase in the mean duration of episodes of wakefulness. Asterisks indicate the levels of statistical significance of the difference between means: ***P < 0.001 by unpaired t-test.

