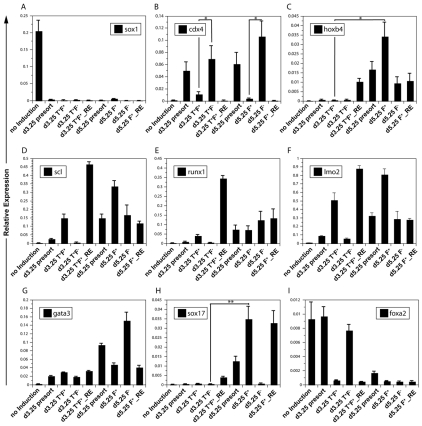
Fig. 2.
Gene expression analyses of different progenitor populations. (A-I) The sorted cell populations isolated in Fig. 1 were analyzed for the expression of the indicated genes by qRT-PCR. Data are presented as expression relative to that of Actb and are the mean of three independent experiments; error bars indicate ±s.d. *, P<0.2; **, P<0.01.

