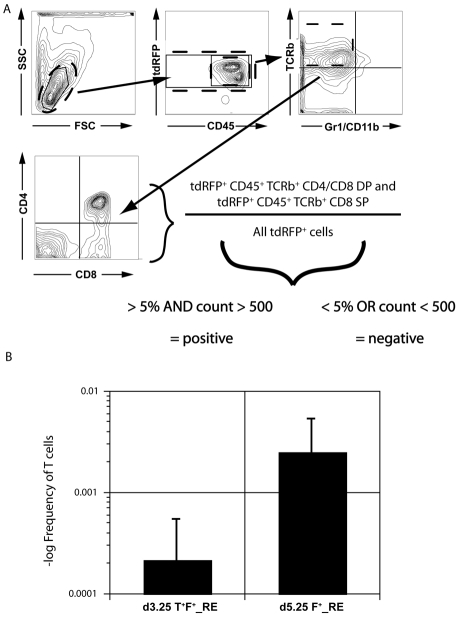
Fig. 4.
T cell potential of the Flk1pos progenitors. (A,B) d3.25 T+ F+_RE or d5.25 F+_RE cells generated from a T-EGFP ESC line expressing tdRFP were seeded over a range of densities on OP9-DL1 stroma cells and cultured for 3 weeks. Media were changed every week. Following culture, the cells were harvested, stained and (A) analyzed for expression of CD45, TCRβ, CD4 and CD8 by flow cytometry and (B) the frequency of T cell progenitors in the two populations (1/4680 for d3.25 versus 1/401 for d5.25) determined. Positive wells were those that contained at least 500 tdRFP+ cells (as a measure of total deposition), of which more than 5% expressed T cell markers as defined by the expression of both CD45+ and TCRβ+ and either CD8 alone or both CD4 and CD8. The frequency of T cell progenitors was then determined using L-Calc software (Stem Cell Technologies). Data are presented as the frequency of T cell progenitors and graphed on a logarithmic scale (n=6).

