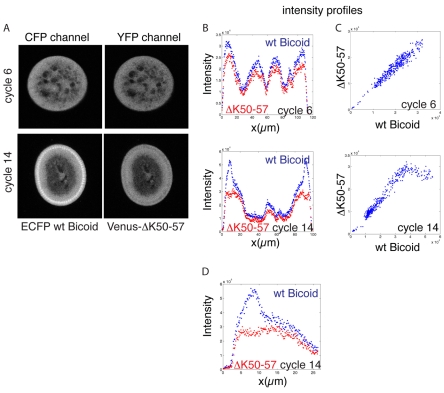
Fig. 4.
Centre-to-surface distribution of Bicoid. (A) Wt and mutant Bicoid in sections of fixed Drosophila embryos in cycle 6 and in cycle 14. (B) Intensity profiles across the centre of the section for cycle 6 and cycle 14 embryos. (C) The relation between the wt and mutant intensities is linear at cycle 6. In cycle 14, this linear relationship is lost within the nuclear layer, where wt levels are high (>40,000 units) and mutant levels are low (∼25,000 units). (D) Intensity profiles for wt and mutant Bicoid within the nucleo-cytoplasmic area (∼25 μm). x-axis plots distance from the embryo surface; nuclei are located between ∼5 and ∼15 μm.

