Figure 8.
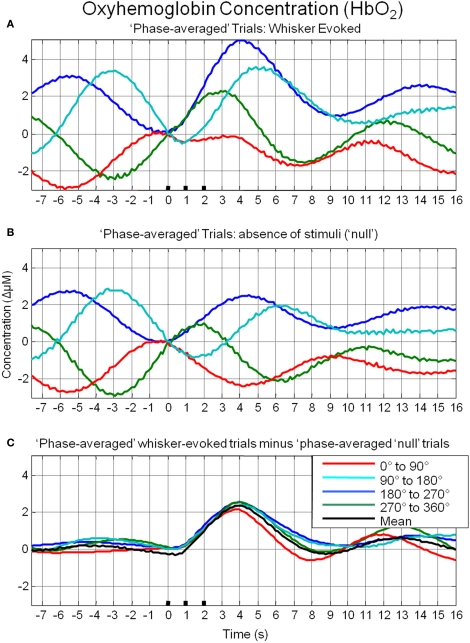
Linear superposition of sensory-evoked and ongoing cortical oxyhemoglobin concentration changes (HbO2). (A) HbO2 responses to sensory stimuli were grouped based on the phase of their pre-stimulus fluctuations at stimulus onset and averaged. (B) HbO2 trial data without presentation of sensory stimuli (“nulls”) are grouped based on the phase of their pre-stimulus fluctuations at the same time point within each trial and averaged. (C) Subtraction of the phase averaged stimulus-evoked responses from their phase averaged null counterpart results in four similar time series.

