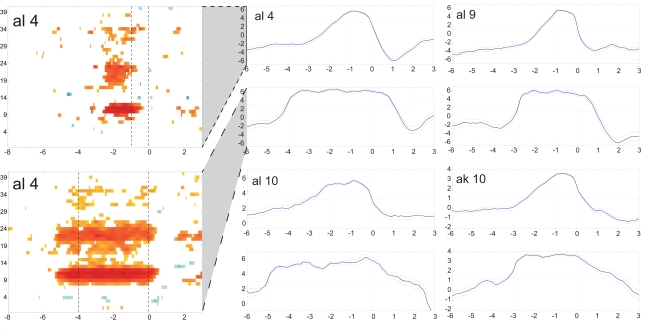
Figure 4.
LDA output of the evaluation procedure with the artificial arm. Averaged LDA output (± standard error) of four subjects for short (upper) and long (lower) switches are given in the panels at the right. The horizontal line represents the threshold to be exceeded for the duration detection. Time duration between the vertical lines show give the time period for short and long motor imagery duration. At the left side an ERD/S map of subject al4 shows the reactive frequency bands during both, the short and long motor imagery.

