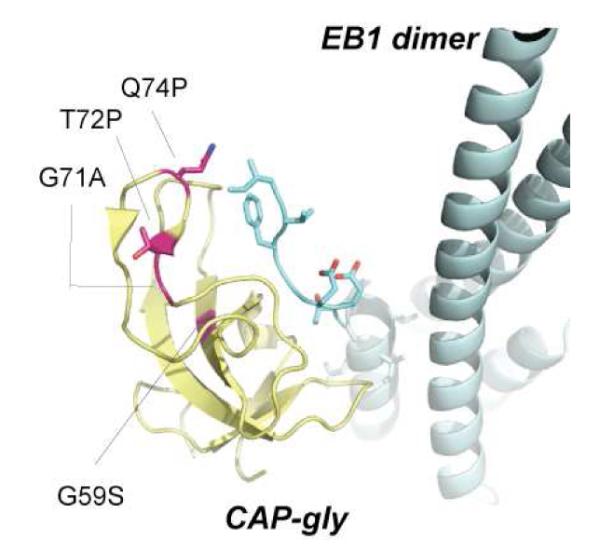
Figure 1.

Ribbon diagram of the p150Glued CAP-gly domain (yellow) bound to EB1 (cyan). The point mutations identified in Perry’s syndrome are shown as sticks in magenta. These mutations are located in a long loop that connects β3 and β4 strands and part of the ‘GKNDG’ binding motif. The location of G59 is also shown.
