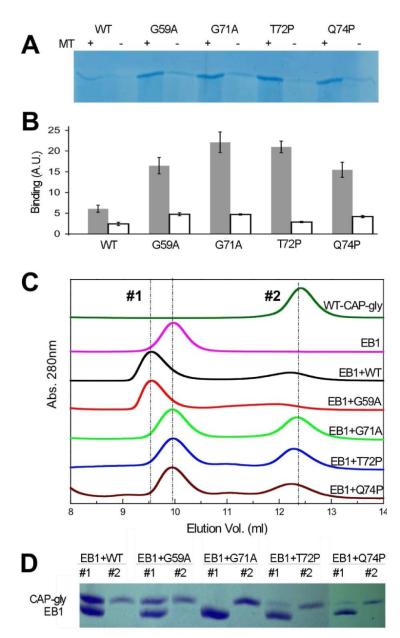
Figure 3.
Characterization of CAP-gly binding interactions: A) SDS-PAGE gel of the pelleted fraction of CAP-gly constructs in the presence and absence of MTs (see Supporting Information). B) Quantification of the intensities of precipitated fractions indicate that the mutated domains bind to taxol stabilized MTs better than the WT construct (grey bars; n=3). The amount of protein precipitated in the absence of MTs is shown as white bars. C) SEC analysis of the CAP-gly interaction with EB1. D) SDS-PAGE analysis of fractions 1 (first peak) and 2 (second peak) shown in panel C).

