
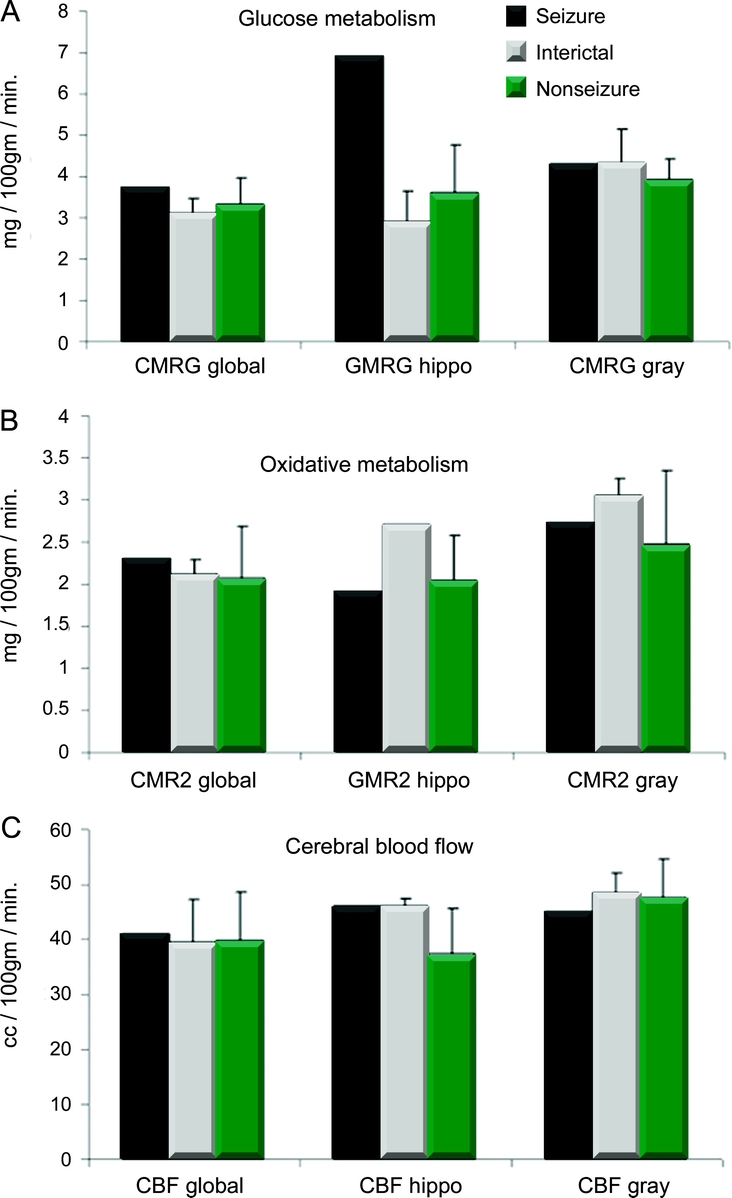
Figure 1 Comparison of the PET images for 1 patient seizing during PET (ictal), the interictal state in the seizure group, and nonseizure group
The global brain metabolism in each group is compared with the regional metabolism in the hippocampus (hippo). (A) Glucose metabolism (mg/100 mg/min); (B) oxidative metabolism (mg/100 mg/min); (C) cerebral blood flow (cc/100 mg/min). The seizure PET shows regionally increased glucose metabolism in the absence of an increase in blood flow or oxidative metabolism.