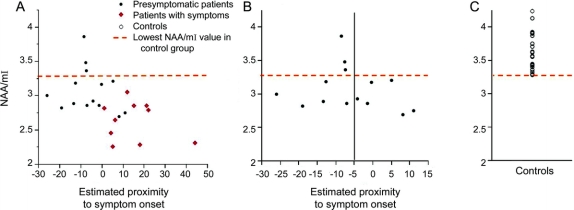
Figure 3 N-acetylaspartate (NAA)/myoinositol (mI) levels and the estimated proximity to symptom onset
NAA/mI ratios in the entire group of MAPT mutation carriers (A) and in only presymptomatic carriers of MAPT mutations (B) compared to the NAA/mI levels in the controls (C). In the horizontal axis, 0 indicates the estimated age at symptom onset based on the median age at symptom onset in symptomatic patients from the same family in presymptomatic patients and the age at actual symptom onset in symptomatic patients. (B) All of the presymptomatic MAPT mutation carriers who are estimated to reach the age at symptom onset in less than 5 years (subjects to the right of the black line on B) or who have passed the estimated age at symptom onset have lower NAA/mI levels than the lowest value in the control range.

