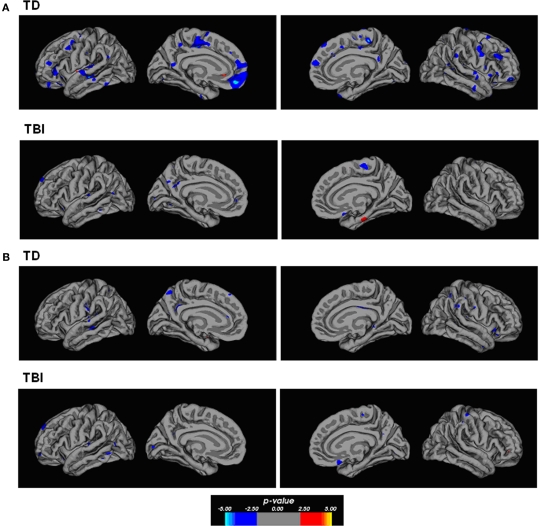
Figure 4.
Correlation maps between gray matter thickness and performance. (A) The maps show evidence of strong inverse correlational relationships between two-relation performance and thickness in several cortical areas within the TD participants. The foci of correlations include areas of the dorsal and ventral frontal lobes with considerable area within the left anterior PFC. Additional areas of correlation included the middle cingulate cortex, and temporal lobe regions. Few regions showed strong correlations within the TBI participants on this same comparison. (B) Both TD and TBI participants showed some degree of inverse correlation between cortical thickness and performance on distractor problems. These foci were primarily observed in the temporal lobes and medial parietal cortex, and medial–dorsal PFC. The p-value in the color bar refers to a −log(10) p-value that is standard in analyses performed in FreeSurfer.

