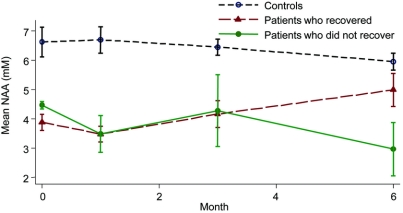
Figure 2 Longitudinal changes in N-acetyl-aspartate levels
Mean N-acetyl-aspartate (NAA) (millimolar) by month with SE in controls, patients who recovered, and patients who did not recover. Changes in NAA seem to be nonlinear. In particular, in patients who recovered during the follow-up period, there was a significant and sustained increase of NAA from baseline to 6 months and from 1 month to 6 months.

