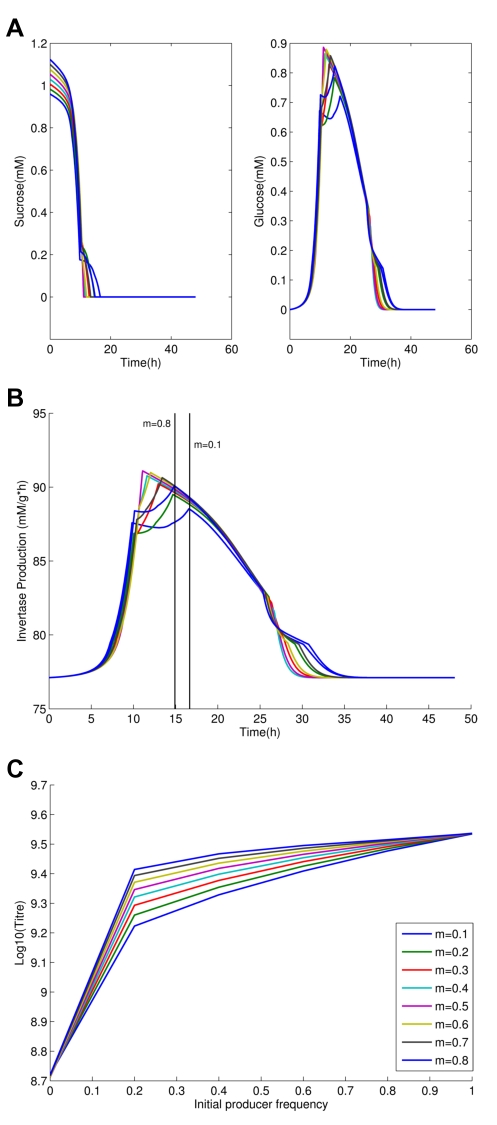
Figure 4. The importance of costly invertase production and its coupling with sucrose levels.
(a) Sucrose and glucose levels (mM/agar) across the time course of the experiment (in the vicinity of region 3); (b) corresponding invertase production levels (mM glucose/g protein/hour); time of sucrose exhaustion is indicated by vertical black lines for m = 0.8 and m = 0.1. Note sucrose has disappeared relatively early but invertase is still produced thereafter; (c) expected final population size (Log(titre)) after exhaustion of resources as a function of initial co-operator frequency when cost of invertase production is reduced from 4% to 2% for invertase production of 86.7 mM glucose/g protein/hour that is 12% higher than the base-level invertase production.

