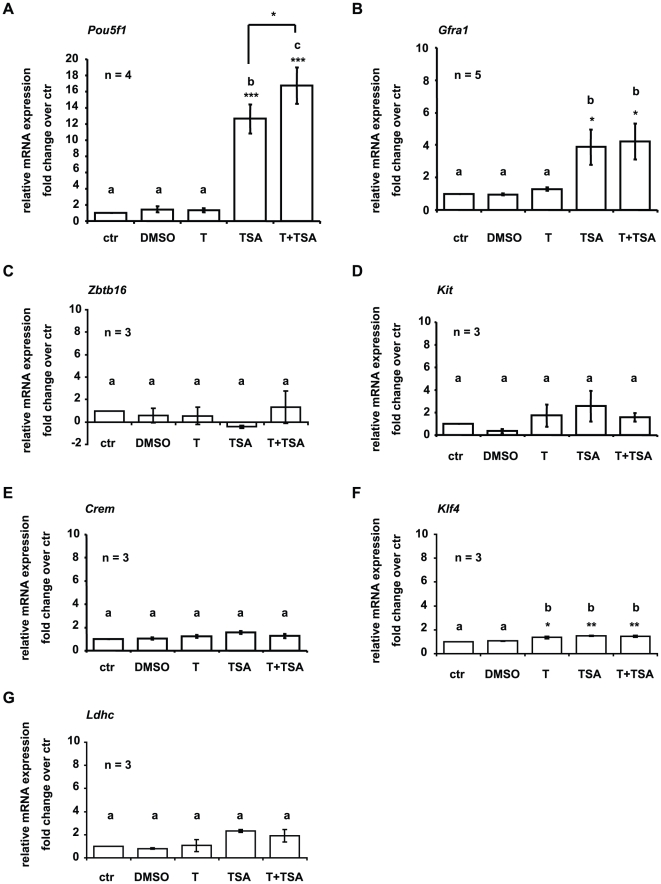
Figure 2. Treatment induces Pou5f1 and Gfra1 gene expression in GC-1 cells.
QPCR analyses of spermatogenic gene expression in GC-1 cells, either grown in culture medium (control, ctr), or treated with tranylcypromine (T), or trichostatin A (TSA), or dimethylsulphoxid (DMSO; TSA solvent), or tranylcypromine and TSA (T+TSA). To avoid detection of expressed pseudogenes a TaqMan assay was performed to analyze Pou5f1 gene expression. Pou5f1 signals were normalized to 18S rRNA. All other genes were analyzed using SYBR green and signals were normalized to Gapdh. Values shown on the graphs are based on the change in expression in treated cells compared to the level of expression in control cells whereby the level of expression in control cells was defined as one. Thereby the fold change in expression indicates the ratio of normalized target gene expression in treated cells over normalized target gene expression in control cells. Data are expressed as mean ± SEM; *p<0.05, **p<0.01, ***p<0.001. Means with different letters are significantly different. N indicates the number of independent experiments, and per experiment each sample and the corresponding negative controls were run in triplicates. Trichostatin A treatment triggers Pou5f1 (A) and Gfra1 (B) gene expression in GC-1 cells. Treatment causes a slight but significant increase in Krueppel-like factor 4 (Klf4) (F) expression. Zinc finger and BTB domain containing 16 (Zbtb16) (C), kit oncogene (Kit) (D), cAMP responsive element modulator (Crem) (E), and lactate dehydrogenase C (Ldhc) (G) are not affected by treatment.

