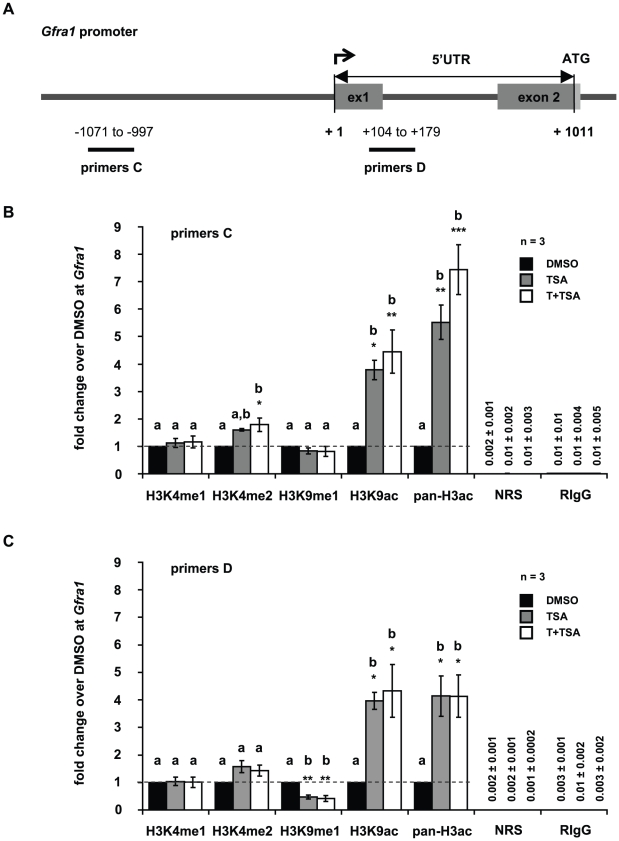
Figure 4. Tranylcypromine and trichostatin A treatment influences posttranslational modifications of histone H3 at Gfra1 promoter.
(A) Schematic representation of the Gfra1 promoter. Numbers depict the positions of primer pairs used for ChIP-qPCR relative to the corresponding transcriptional start site. (B,C) Analyses of histone H3 methylation and acetylation levels in the Gfra1 promoter by ChIP and qPCR in GC-1 cells that have been cultured in the presence of dimethylsulphoxide (DMSO, control, black bars), or trichostatin A (TSA, grey bars), or both inhibitors, tranylcypromine and TSA (T+TSA, white bars). Signals of target DNA received from DMSO control cells served as base and were defined as one. Fold change indicates 2∧-(ΔΔCT) of target DNA in treated cells over 2∧-(ΔΔCT) of target DNA in DMSO controls (Y-axis). Epigenetic modifications are depicted on the X-axis. Data are expressed as mean ± SEM; *p<0.05, **p<0.01, ***p<0.001. Means with different letters are significantly different. N indicates the number of independent experiments, and per experiment each sample and the corresponding negative controls were run in triplicates.

