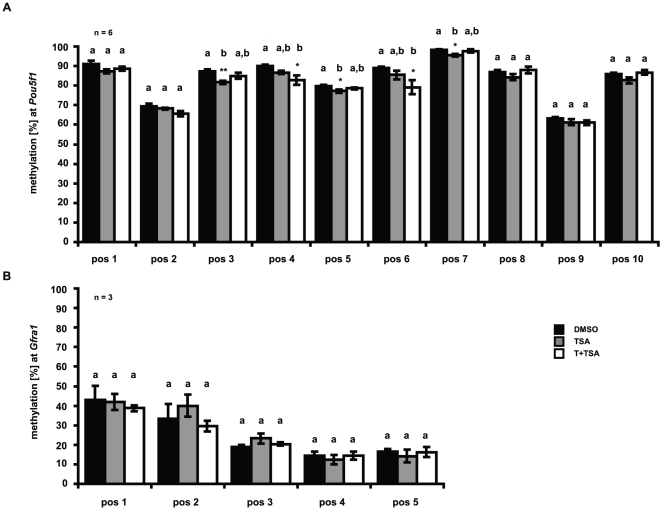
Figure 6. Effect of tranylcypromine and trichostatin A treatment on CpG methylation at Pou5f1 and Gfra1 promoters.
DNA was extracted, treated with bisulfite, amplified by PCR and pyrosequencing was used to determine the bisulfite-converted sequence of CpG sites in (A) Pou5f1 (positions −190 to +26 relative to the transcriptional start site) and (B) Gfra1 promoters (positions +26 to +143 relative to the transcriptional start site). The methylation status of each position is depicted as the mean percentage of “n” independent experiments ± SEM; *p<0.05, **p<0.01. Means with different letters are significantly different. Black bars indicate DMSO controls, grey bars depict TSA treated samples and white bars represent samples that have been exposed to both inhibitors, tranylcypromine and TSA (T+TSA).

