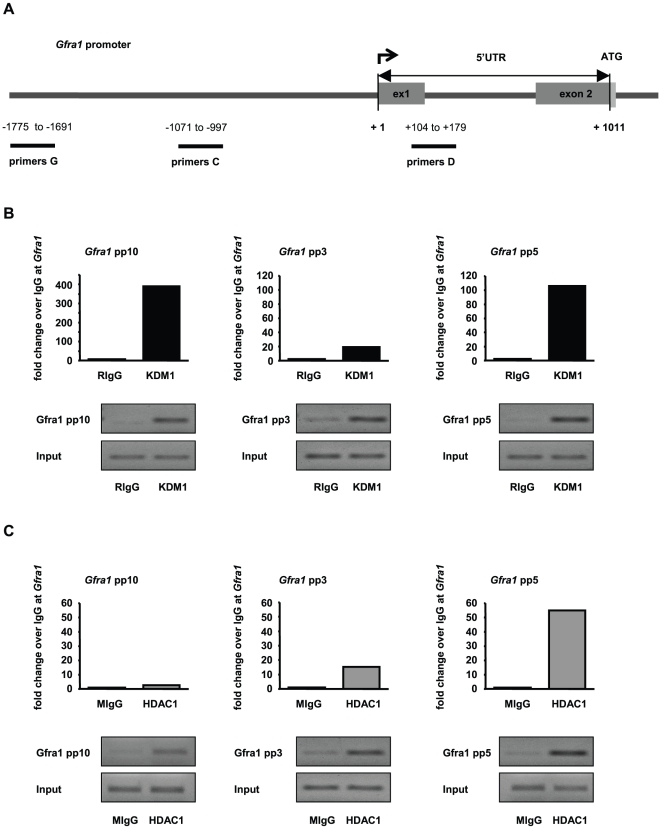
Figure 8. KDM1- and HDAC1-containing protein complexes are located at the Gfra1 promoter in GC-1 cells.
(A) Schematic representation of the Gfra1 promoter. Numbers depict the positions of primer pairs used for ChIP-qPCR relative to the corresponding transcriptional start site. (B,C) ChIP-qPCRs demonstrate occupancy of the Gfra1 promoter by KDM1- (B) and HDAC1-containing protein complexes (C). ChIP assays were performed on GC-1 cells that have been cultured in the presence of dimethylsulphoxide using either a specific antibody (recognizing either KDM1 (black bars) or HDAC1 (grey bars)) or the corresponding IgG controls (white bars), (rabbit IgG = RIgG; mouse IgG = MIgG). Each bar represents the ChIP-qPCR results of two independent, pooled experiments. Signals of target DNA received from IgG controls served as base and were defined as one. Fold change represents the 2∧-(ΔΔCT) value, where the normalized IgG signal is subtracted from the normalized signal of the specific antibody. QPCR results were analyzed on an agarose gel and shown underneath the corresponding graph.

