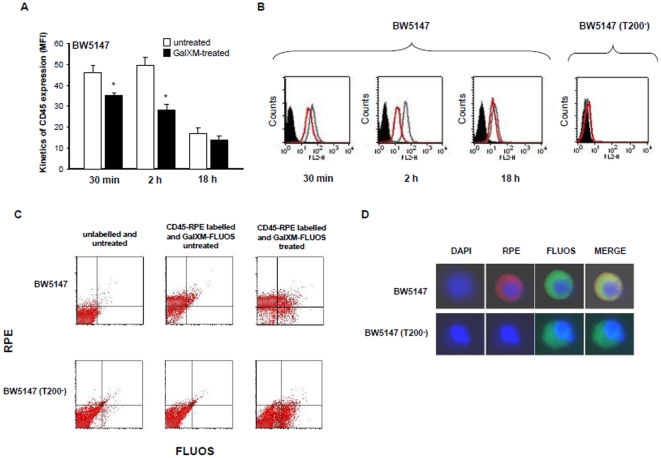
Figure 2. CD45 expression on BW5147 cells treated with GalXM and GalXM colocalization with CD45.
BW5147 and BW5147 (T200−) cells (both 1×10⁶/ml) were incubated for 30 min, 2 h or 18 h in the presence or absence of GalXM (10 µg/ml). After incubation, cells were labelled with RPE mAb to CD45 and analyzed by FACScan flow cytometry. The mean of fluorescence intensity (MFI) of labelled cells is shown as a histogram (A) or is shown as FACScan histograms (B). Error bars denote s.e.m. *, p<0.05 (GalXM-treated vs untreated, n = 7). In selected experiments, cells (1×10⁶/ml) were incubated for 30 min in the presence or absence of GalXM-FLUOS (10 µg/ml). After incubation, cells were labelled with RPE mAb to CD45 and analyzed by FACScan flow cytometry. Dot plots of the percentage of double positive cells, from one representative experiment out of five with similar results, were reported (C). Cells (1×10⁶/ml) were incubated for 30 min with GalXM-FLUOS (10 µg/ml) (green), labelled with RPE mAb to CD45 (red), stained with DAPI (blue) and subsequently examined under fluorescent light microscopy (D).

