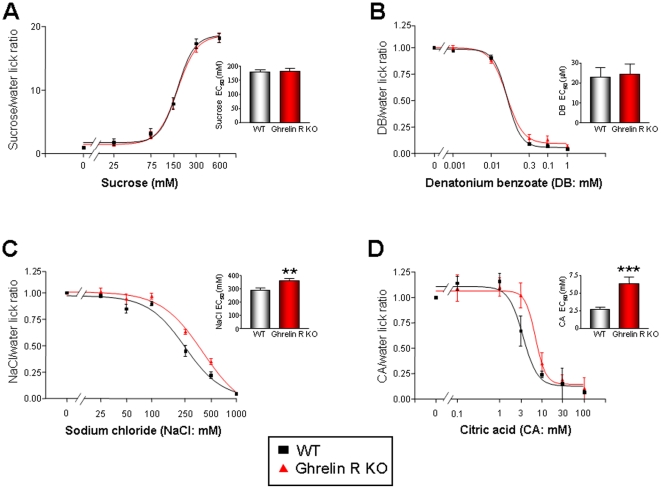
Figure 6. Altered salt and sour taste responses of WT and GHSR null mice in brief access taste tests.
Taste responses, expressed as tastant/water lick ratios and as a function of stimulus concentration, of GHSR null, (red) and WT (black) to (A) sucrose, (B) DB, (C) NaCl and (D) CA. Points are expressed as means ± S.E.M. Curves were fit as described in Methods. **p<0.01; ***p<0.001.

