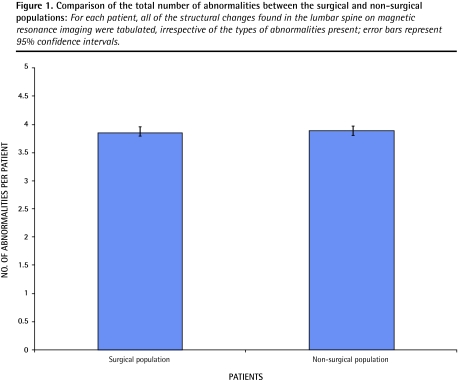
Figure 1.
Comparison of the total number of abnormalities between the surgical and non-surgical populations: For each patient, all of the structural changes found in the lumbar spine on magnetic resonance imaging were tabulated, irrespective of the types of abnormalities present; error bars represent 95% confidence intervals.

