
Figure 4.
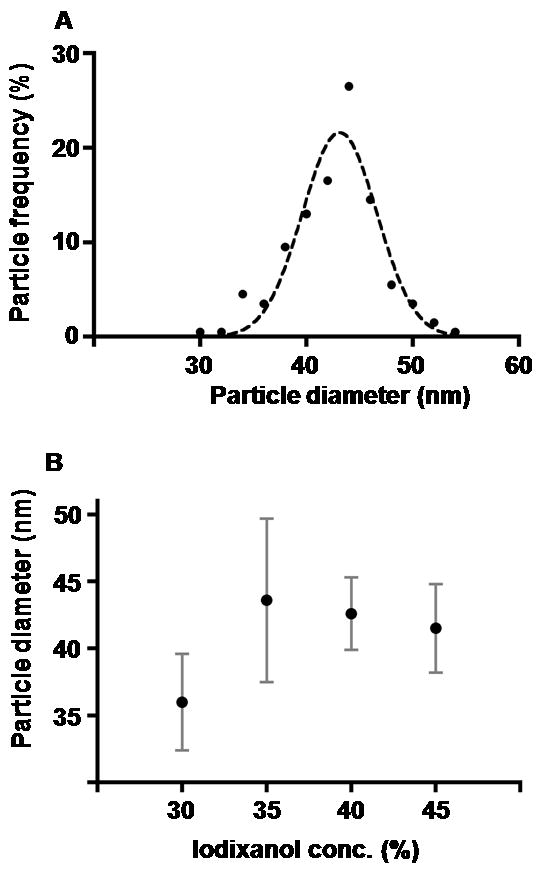
Pre-viral nucleocapsid diameters. (A) Frequency distribution plot of diameters of pre-viral nucleocapsids (n=200) recovered from the cushion stage of purification. The dashed line shows a Gaussian curve fit to the data points. Particle diameters were measured from micrographs of vitrified particles. Measurement errors were ±1.8 nm, based on multiple diameter measurements for each particle. (B) Average diameter of pre-viral nucleocapsids (n=100) recovered from distinct iodixanol gradient fractions. Particle diameters were measured from electron micrographs of negatively stained particles. Error bars were ±2 nm, based on multiple diameter measurements for each particle.