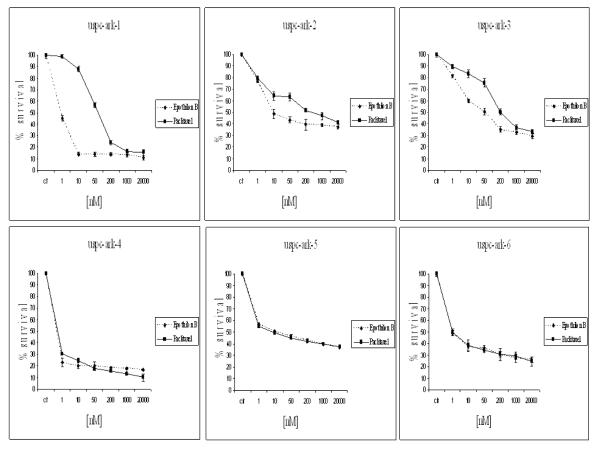
Figure 2. Representative dose-response curves following exposure to patupilone versus paclitaxel of USPC primary cell lines with High versus Low HER-2/neu expression.
Survival was assessed by MTS assay as described in the Methods section. Each point on the cell line graph represents the mean of 3 estimations + SE.

