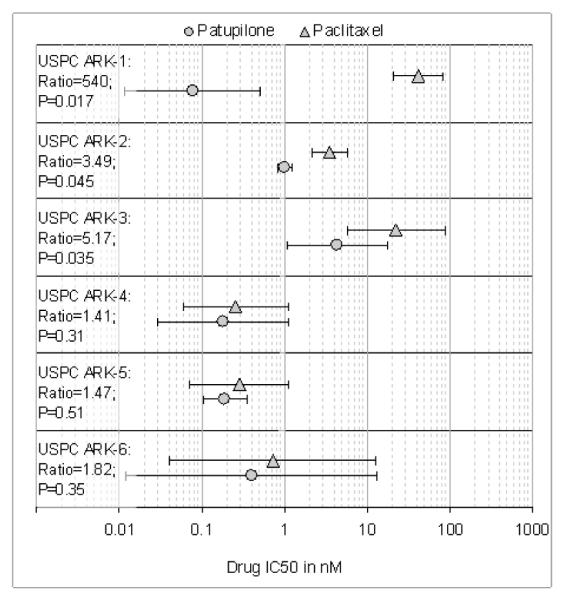
Figure 3. IC50s of Patupilone and Paclitaxel in six USPC cell lines.

Symbols (error bars) denote means (standard deviations) of IC50s. Text to the left of the symbols denotes the cell line, its paclitaxel/patupilone ratio of IC50s, and the ratio’s P value. Note that the individual ratios are significant (at P<0.05) for the cell lines that show HER-2/neu amplification by FISH, but not significant in the cell lines that don’t. As a class, the three HER-2/neuamplified lines taken together showed significantly lower IC50s for patupilone compared to paclitaxel (P=0.0002), whereas the three unamplified lines taken together did not (P=0.54).
