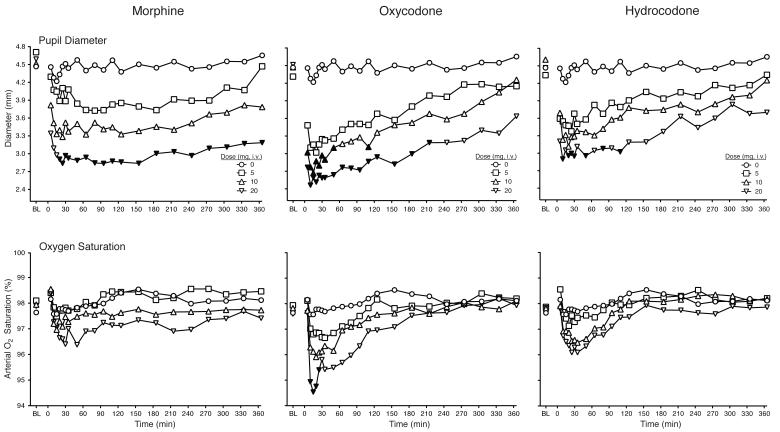
Figure 1.
Data are shown for mean values (n=9) for pupil diameter (top panel) and oxygen saturation (bottom panel) after administration of morphine (left column), oxycodone (middle column) and hydrocodone (right column) as a function of time (X-axis) since drug administration in the 6 h session. Error bars omitted for clarity. Filled symbols indicate a significant difference from the corresponding placebo time point. Time course analysis revealed significant interactions of dose and time condition for pupil diameter and oxygen saturation (F189,1509 = 2.0, p < 0.0001; F189, 1507 = 1.4, p = 0.001, respectively).

