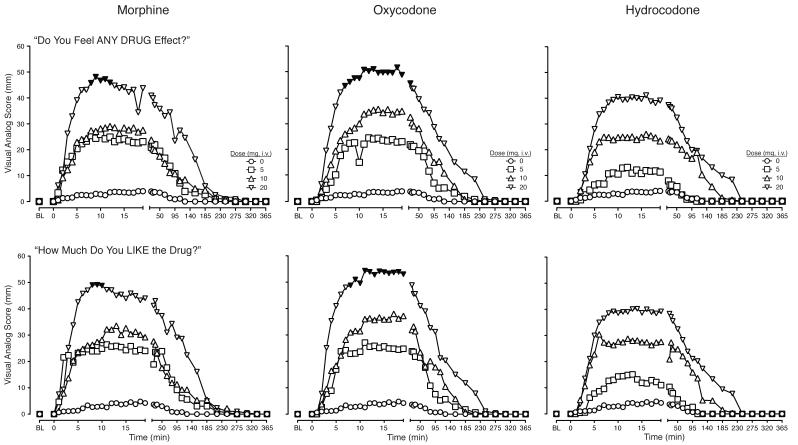
Figure 2.
Data are shown for mean values (n=9) for responses to “Do you feel any DRUG EFFECT?” (top panel) and “How much do you “LIKE” the drug?” (bottom panel) after administration of morphine (left column), oxycodone (middle column) and hydrocodone (right column) as a function of time (X-axis) since drug administration in the 6 h session. The maximum score is 100. Error bars omitted for clarity. Filled symbols indicate a significant difference from the corresponding placebo time point. Time course analysis revealed significant interactions of dose and time condition for “Do you feel any DRUG EFFECT?” and “How much do you “LIKE” the drug?” (F333,2661 = 1.4, p < 0.0001; F333,2662 = 1.3, p = 0.002, respectively).

