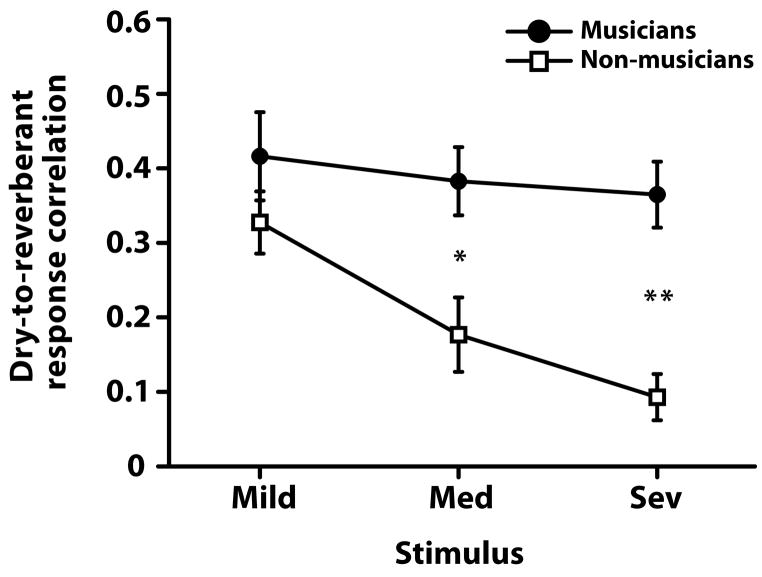
Figure 5.
Dry-to-reverberant response correlations. The degree of correlation (Pearson’s r) between reverberant (mild, medium, and severe) and dry responses were computed for each participant. Only the steady-state portions of the FFRs were considered (15–250 ms). Higher correlation values indicate greater correspondence between neural responses in the absence and presence of reverberation. Across increasing levels of reverberation, musicians show higher correlation between their reverberant and dry (i.e., no reverberation) responses than non-musician participants. A significant group x stimulus interaction [F2,36 = 3.92, p = 0.028] indicates that musicians’ FFRs are more resistant to the negative effects of reverberation than non-musicians, especially in medium and severe conditions. Error bars represent ± 1 SE. Group difference: *p < 0.01, **p < 0.001.

